These functions provide convenient ggplot2 layers for drawing vector fields using streamlines.
Usage
geom_vector_field(
  mapping = NULL,
  data = NULL,
  stat = StatStreamField,
  position = "identity",
  ...,
  na.rm = FALSE,
  show.legend = NA,
  inherit.aes = FALSE,
  fun,
  xlim = NULL,
  ylim = NULL,
  n = 11,
  args = list(),
  center = TRUE,
  normalize = TRUE,
  tail_point = FALSE,
  eval_point = FALSE,
  grid = NULL,
  lineend = "butt",
  linejoin = "round",
  linemitre = 10,
  arrow = grid::arrow(angle = 30, length = unit(0.02, "npc"), type = "closed")
)

stat_vector_field(
  mapping = NULL,
  data = NULL,
  stat = StatStreamField,
  geom = GeomStream,
  position = "identity",
  ...,
  na.rm = FALSE,
  show.legend = NA,
  inherit.aes = FALSE,
  fun,
  xlim = NULL,
  ylim = NULL,
  n = 11,
  args = list(),
  center = TRUE,
  normalize = TRUE,
  tail_point = FALSE,
  eval_point = FALSE,
  grid = NULL,
  lineend = "butt",
  linejoin = "round",
  linemitre = 10,
  arrow = grid::arrow(angle = 30, length = unit(0.02, "npc"), type = "closed")
)

geom_vector_field2(
  mapping = NULL,
  data = NULL,
  stat = StatStreamField,
  position = "identity",
  ...,
  na.rm = FALSE,
  show.legend = TRUE,
  inherit.aes = FALSE,
  fun,
  xlim = NULL,
  ylim = NULL,
  n = 11,
  args = list(),
  center = FALSE,
  tail_point = TRUE,
  eval_point = FALSE,
  grid = NULL,
  lineend = "butt",
  linejoin = "round",
  linemitre = 10,
  arrow = NULL
)

stat_vector_field2(
  mapping = NULL,
  data = NULL,
  geom = GeomStream,
  position = "identity",
  ...,
  na.rm = FALSE,
  show.legend = TRUE,
  inherit.aes = FALSE,
  fun,
  xlim = NULL,
  ylim = NULL,
  n = 11,
  args = list(),
  center = FALSE,
  tail_point = TRUE,
  eval_point = FALSE,
  grid = NULL,
  lineend = "butt",
  linejoin = "round",
  linemitre = 10,
  arrow = NULL
)
Arguments
- mapping
A set of aesthetic mappings created by
ggplot2::aes(). Additional aesthetics such ascolor,size,linetype, andalphacan be defined. In geom_vector_field, the default mapping includescolor = after_stat(norm), whereas in geom_vector_field2 the default mapping includeslength = after_stat(norm).- data
A data frame containing the input data.
- stat
The statistical transformation to use on the data for this layer. Defaults to StatStreamField.
- position
Position adjustment, either as a string or the result of a call to a position adjustment function.
- ...
Other arguments passed on to
grid::layer().- na.rm
Logical. If
FALSE(the default), missing values are removed with a warning.- show.legend
Logical. Should this layer be included in the legends?
- inherit.aes
Logical. If
FALSE, overrides the default aesthetics rather than combining with them.- fun
A function that defines the vector field. It should take a numeric vector of length 2 (representing \((x, y)\)) and return a numeric vector of length 2 (representing \((dx, dy)\)). (Required)
- xlim
Numeric vector of length two. Specifies the limits of the x-axis domain. Defaults to
c(-1, 1).- ylim
Numeric vector of length two. Specifies the limits of the y-axis domain. Defaults to
c(-1, 1).- n
Integer. Grid resolution specifying the number of seed points along each axis. Higher values produce a denser vector field. Defaults to
11.- args
List of additional arguments passed on to the function defined by
fun.- center
Logical. If
TRUE, centers the seed points or the vectors so that the original (x, y) becomes the midpoint. Defaults differ between the variants.- normalize
Logical. If
TRUE, stream lengths are normalized based on grid spacing. IfFALSE, a default arc length is used. (Default isTRUE; ifTRUE, it is converted internally to"vector".)- tail_point
Logical. If
TRUE, a point is drawn at the tail of each streamline.- eval_point
Logical. If
TRUE, a point is drawn at the evaluation point, corresponding to the original (untransformed) seed point before any centering or normalization is applied.- grid
A data frame containing precomputed grid points for seed placement. If
NULL(default), a regular Cartesian grid is generated based onxlim,ylim, andn.- lineend
Line end style (round, butt, square).
- linejoin
Line join style (round, mitre, bevel).
- linemitre
Line mitre limit (number greater than 1).
- arrow
A
grid::arrow()specification to add arrowheads to the streamlines. In geom_vector_field, the default is a closed arrow with a 30° angle and length0.02npc; in geom_vector_field2 the default isNULL.- geom
The geometric object used to render the streamline (only used in
stat_stream(); defaults to GeomStream).
Value
A ggplot2 layer that computes and plots a vector field using streamlines.
- norm
Calculated as the Euclidean distance between the starting point (
x,y) and the computed endpoint. Used to normalize the vector.
Details
A user-defined function (fun) specifies the behavior of the vector field by
taking a numeric vector of length 2 (representing \((x, y)\)) and returning
a numeric vector of length 2 (representing \((dx, dy)\)). The underlying
StatStreamField computes the streamlines based on the vector field
function, and GeomStream renders them.
Two variants are provided:
geom_vector_field() uses a default mapping that sets
color = after_stat(norm).geom_vector_field2() uses a default mapping that sets
length = after_stat(norm)(withcolorunmapped by default).
Aesthetics
geom_vector_field() and geom_vector_field2()
understand the following aesthetics (required aesthetics are in bold):
x: The x-coordinate of the vector's starting point.y: The y-coordinate of the vector's starting point.fx: The horizontal component of the vector displacement.fy: The vertical component of the vector displacement.color: The color of the vector lines (default mapping in geom_vector_field).length: The computed vector norm (default mapping in geom_vector_field2).linetype: The type of the vector line (e.g., solid, dashed).linewidth: The thickness of the vector line.alpha: The transparency of the vector.
Examples
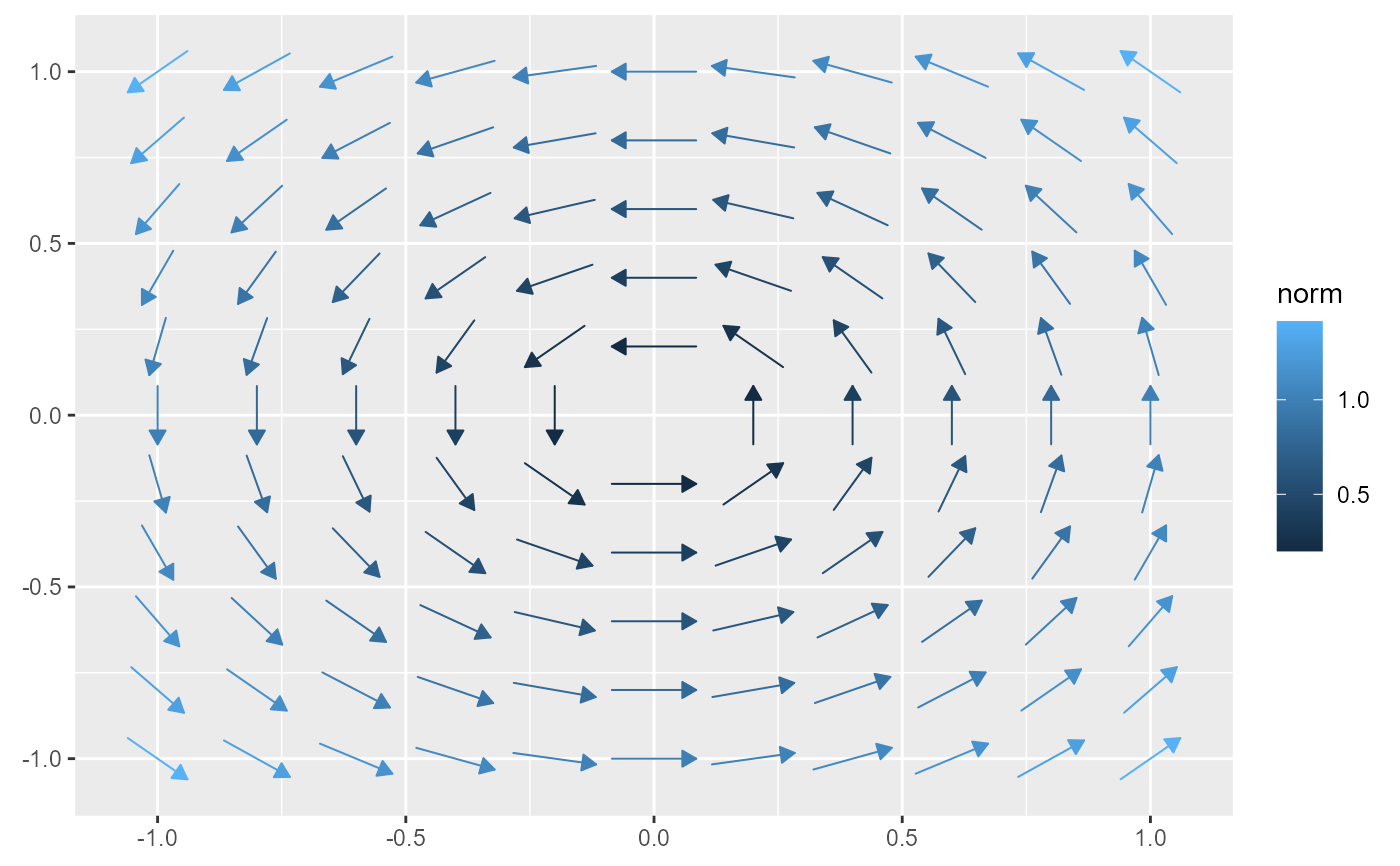
f <- function(u) c(-u[2], u[1])
ggplot() + geom_vector_field(fun = f, xlim = c(-1,1), ylim = c(-1,1))

if (FALSE) { # \dontrun{
# xlim and ylim default to (-1,1), so for ease of illustration we remove them

ggplot() + geom_vector_field(fun = f)
ggplot() + geom_vector_field(fun = f, grid = "hex")

ggplot() + geom_vector_field2(fun = f)
ggplot() + geom_vector_field2(fun = f, grid = "hex")

f <- efield_maker()
ggplot() + geom_vector_field(fun = f, xlim = c(-2,2), ylim = c(-2,2))
ggplot() + geom_vector_field2(fun = f, xlim = c(-2,2), ylim = c(-2,2))
} # }
if (FALSE) { # \dontrun{
# xlim and ylim default to (-1,1), so for ease of illustration we remove them
ggplot() + geom_vector_field(fun = f)
ggplot() + geom_vector_field(fun = f, grid = "hex")
ggplot() + geom_vector_field2(fun = f)
ggplot() + geom_vector_field2(fun = f, grid = "hex")
f <- efield_maker()
ggplot() + geom_vector_field(fun = f, xlim = c(-2,2), ylim = c(-2,2))
ggplot() + geom_vector_field2(fun = f, xlim = c(-2,2), ylim = c(-2,2))
} # }