Plot a Vector or Stream Field from a 2D Vector-Valued Function
Source:R/geom_function_2d_2d.R
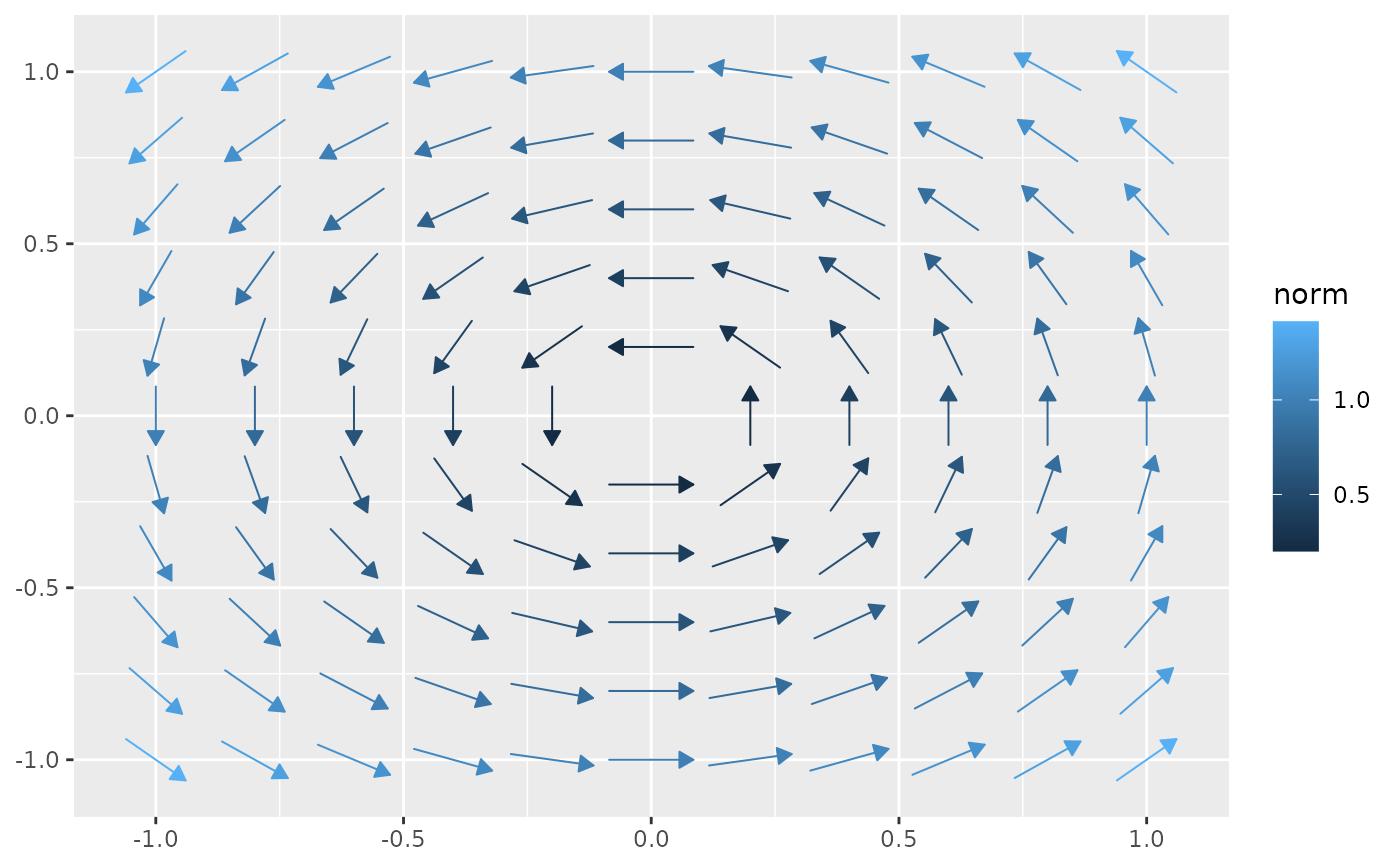
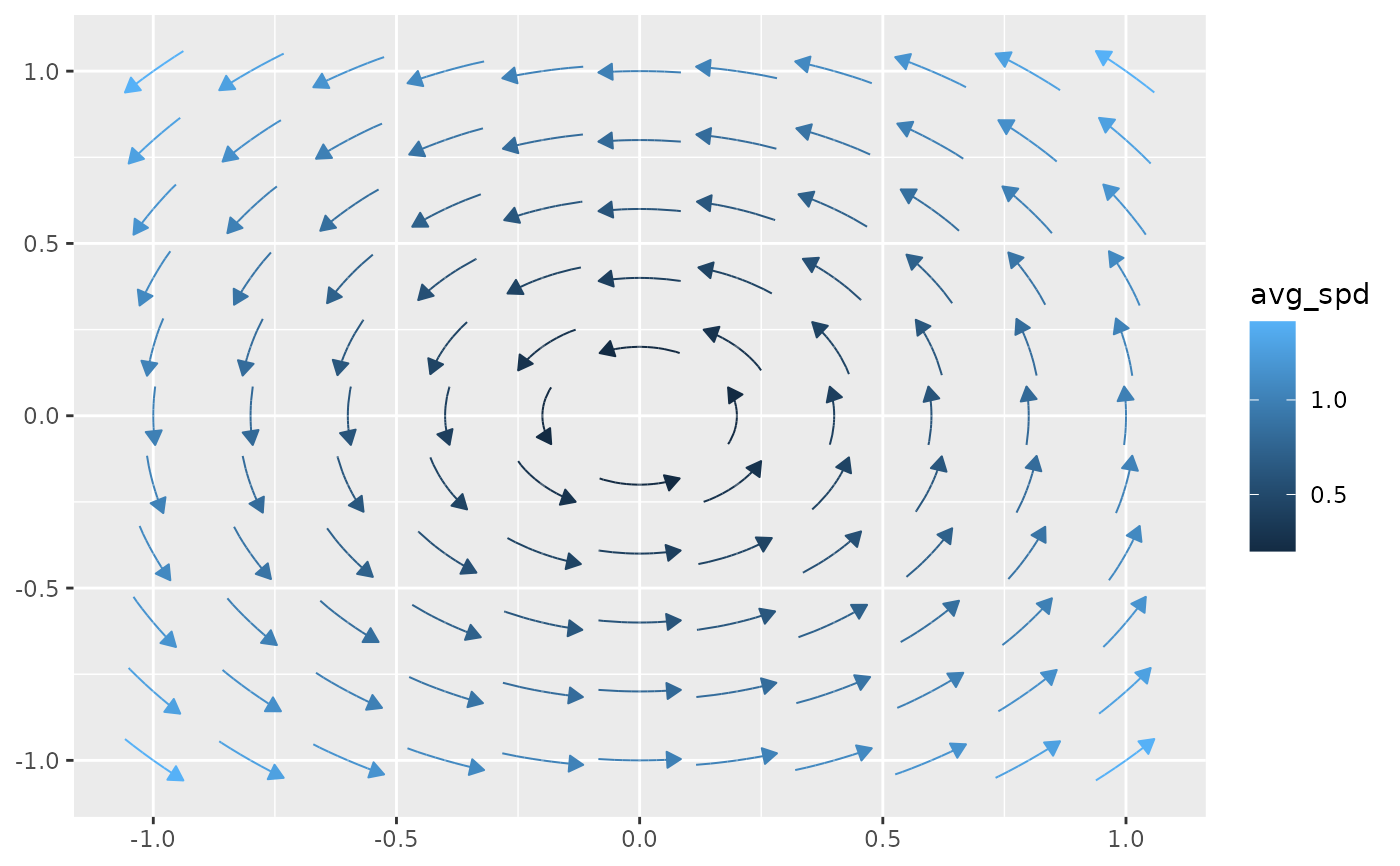
geom_function_2d_2d.Rdgeom_function_2d_2d() evaluates a user-defined vector field
\(\mathbf{F}(x,y) = (dx, dy)\) on a grid and renders it as either a
vector field (short arrows at each grid point, the default) or a stream
field (integral curves). It wraps ggvfields::geom_vector_field() for
type = "vector" and ggvfields::geom_stream_field() for
type = "stream".
Usage
geom_function_2d_2d(
  mapping = NULL,
  data = NULL,
  position = "identity",
  ...,
  na.rm = FALSE,
  show.legend = NA,
  inherit.aes = FALSE,
  fun,
  xlim = NULL,
  ylim = NULL,
  n = 11,
  args = list(),
  type = "vector",
  center = TRUE,
  normalize = TRUE,
  tail_point = FALSE,
  eval_point = FALSE,
  grid = NULL,
  arrow = grid::arrow(angle = 30, length = grid::unit(0.02, "npc"), type = "closed"),
  max_it = 1000,
  T = NULL,
  L = NULL,
  method = "rk4"
)

stat_function_2d_2d(
  mapping = NULL,
  data = NULL,
  geom = ggvfields::GeomStream,
  position = "identity",
  ...,
  na.rm = FALSE,
  show.legend = NA,
  inherit.aes = TRUE,
  fun,
  xlim = NULL,
  ylim = NULL,
  n = 11,
  args = list(),
  max_it = 1000,
  T = NULL,
  L = NULL,
  center = TRUE,
  normalize = TRUE,
  tail_point = FALSE,
  eval_point = FALSE,
  grid = NULL,
  method = "rk4",
  arrow = grid::arrow(angle = 30, length = grid::unit(0.02, "npc"), type = "closed")
)
Arguments
- mapping
Set of aesthetic mappings created by
aes(). If specified andinherit.aes = TRUE(the default), it is combined with the default mapping at the top level of the plot. You must supplymappingif there is no plot mapping.- data
The data to be displayed in this layer. There are three options:
NULL(default): the data is inherited from the plot data as specified in the call toggplot().A
data.frame, or other object, will override the plot data. All objects will be fortified to produce a data frame. Seefortify()for which variables will be created.A
functionwill be called with a single argument, the plot data. The return value must be adata.frame, and will be used as the layer data. Afunctioncan be created from aformula(e.g.~ head(.x, 10)).
- position
A position adjustment to use on the data for this layer. This can be used in various ways, including to prevent overplotting and improving the display. The
positionargument accepts the following:The result of calling a position function, such as
position_jitter(). This method allows for passing extra arguments to the position.A string naming the position adjustment. To give the position as a string, strip the function name of the
position_prefix. For example, to useposition_jitter(), give the position as"jitter".For more information and other ways to specify the position, see the layer position documentation.
- ...
Other arguments passed to
ggplot2::layer().- na.rm
If
FALSE, the default, missing values are removed with a warning. IfTRUE, missing values are silently removed.- show.legend
Logical. Should this layer be included in the legends?
NA, the default, includes if any aesthetics are mapped.FALSEnever includes, andTRUEalways includes. It can also be a named logical vector to finely select the aesthetics to display. To include legend keys for all levels, even when no data exists, useTRUE. IfNA, all levels are shown in legend, but unobserved levels are omitted.- inherit.aes
If
FALSE, overrides the default aesthetics, rather than combining with them. This is most useful for helper functions that define both data and aesthetics and shouldn't inherit behaviour from the default plot specification, e.g.annotation_borders().- fun
A function accepting a length-2 numeric vector and returning a length-2 numeric vector \((dx, dy)\).
- xlim, ylim
Numeric vectors of length 2 specifying the domain limits. Default to \(c(-1, 1)\).
- n
Integer or two-element integer vector. Number of seed points along each axis. Defaults to
11.- args
A named list of additional arguments passed to
fun.- type
Character. Either
"vector"(default) for short arrows at each grid point, or"stream"for full integral-curve streamlines.- center
Logical. If
TRUE(default), centers each arrow/streamline on its seed point.- normalize
Logical. If
TRUE(default), normalizes arrow/streamline lengths relative to grid spacing.- tail_point
Logical. If
TRUE, draws a point at the tail of each arrow or streamline. Defaults toFALSE.- eval_point
Logical. If
TRUE, draws a point at the seed point. Defaults toFALSE.- grid
A data frame of precomputed seed points. If
NULL(default), a regular grid is generated fromxlim,ylim, andn.- arrow
A
grid::arrow()specification. Defaults to a closed arrow at 30° with length0.02 npc.- max_it
Integer. Maximum integration steps per streamline (
type = "stream"only). Defaults to1000.- T
Numeric. Maximum integration time (
type = "stream"only).- L
Numeric. Maximum arc length (
type = "stream"only, whennormalize = TRUE).- method
Character. Integration method, e.g.
"rk4"or"euler"(type = "stream"only). Defaults to"rk4".- geom
The geometric object to use to display the data. Defaults to ggvfields::GeomStream.
See also
ggvfields (Turner, Kahle, and Sturdivant) for a richer collection of vector field tools including gradient fields, stream plots, and potential functions: https://github.com/dusty-turner/ggvfields.