Lesson 34: Project Peer Review
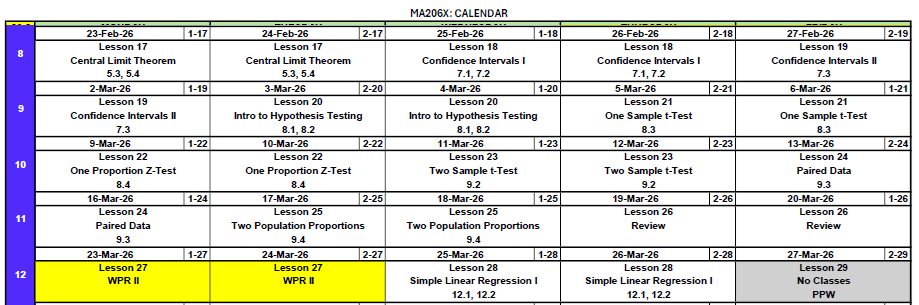
What We Did: Lessons 28, 30, 31, 32, 33
NoteLesson 28: Simple Linear Regression I
- Least squares fits \(\hat{y} = b_0 + b_1 x\) by minimizing \(\sum(y_i - \hat{y}_i)^2\)
- Slope \(b_1\): predicted change in \(y\) for a 1-unit increase in \(x\)
- Residuals: \(e_i = y_i - \hat{y}_i\)
NoteLesson 30: Simple Linear Regression II
- Test the slope with \(t = b_1 / SE(b_1)\)
- \(R^2\) measures the fraction of variability in \(y\) explained
- Categorical predictors use indicator variables with a reference level
NoteLesson 31: Multiple Linear Regression I
- Interpret each slope holding other variables constant
- LINE assumptions: Linearity, Independence, Normality, Equal variance
- Check with residuals vs. fitted, QQ plot, and scale-location plots
NoteLesson 32: Multiple Linear Regression II
- Applied MLR to project datasets in Vantage
- Variable selection and assumption checking
NoteLesson 33: Inference and Regression Walkthrough
- Walked through one-sample t, two-sample t, and MLR on a synthetic cadet dataset
- Iterated the MLR by removing an insignificant predictor
- Rhythm: visualize → test → check conditions → takeaway
Before You Leave
Next Lesson
Lesson 35: Course Lecture Drop
- Use the time for project work or office hours
- Tech Report due Lesson 36
ImportantPresentations
If you will not be here for the project presentation, let me know now so I can plan accordingly.
Upcoming Graded Events
- Tech Report – Due Lesson 36